
What do we know about our planet’s climate system? Is the climate changing? Is this due to human influence? How do we know? Can we make predictions about the future? What will be the impact of climate change over time? What do we need to do to address it?
On this page we’ll learn some of the science needed to answer these questions. We’ll start with short answers, and then we’ll explore these ideas in more detail. To get started, expand the blue bars below.
References: All scientific claims here are supported by strong evidence in the peer-reviewed scientific literature. Rather than list literature citations, we refer to relevant passages in the UN's IPCC reports. The UN's Intergovernmental Panel on Climate Change (IPCC) issues regular Assessment Reports (AR). These reports are surveys of the literature on climate change and its impacts. They will guide you through the evidence and refer you to the original publications. For example, "AR5 WG1 1.2.2" is a reference to Section 1.2.2 in Working Group I's contribution to Assessment Report 5. For links to the IPCC reports, see our list of Additional Resources.
- What’s happening? Our global climate system is retaining more heat (energy) due to increased concentrations of greenhouse gases, such as carbon dioxide (CO2), in the atmosphere. This is leading to changes in global and regional climate, such as changes in average temperature, precipitation, wind and ocean currents, and storm activity. In addition, when there is more CO2 in the atmosphere, the oceans absorb more CO2, creating carbonic acid. Our oceans are becoming more acidic.
- What’s causing it? While the climate varies naturally over long periods of time, the rapid changes we’re experiencing now are caused by human activities, such as the burning of fossil fuels, deforestation, and large-scale food production. Many of these activities release greenhouse gases such as carbon dioxide and methane into the air. Since plants absorb CO2, deforestation also contributes to elevated levels of greenhouse gases in the atmosphere.
- What are the consequences of climate change? As ocean water warms and expands, and as polar ice caps melt, sea levels rise, and many coastal areas will become uninhabitable. Changes in average temperature, wind patterns, and ocean currents mean that some parts of the world will get hotter, and some will get colder. Many areas will have greater temperature variability, with colder lows and hotter highs. Changes in climate and the acidification of the oceans cause changes in habitats and ecosystems. Many species of plants and animals will be unable to adapt to such rapid change, and they will go extinct. Changes in precipitation and mountain snow cover will reduce the availability of fresh water in many areas and affect food production. Some parts of the world might become drier, and others might experience more flooding. Some countries might see a rise in civil unrest and armed conflict due to loss of homes, food scarcity, and economic uncertainty, and refugee populations might increase as people are displaced from their communities. While it’s difficult to predict the exact consequences in any given region, we can expect that climate change will have many negative consequences for societies and ecosystems around the world. Some of these consequences are already occurring; others will take place gradually or abruptly during the 21st Century and into the future.
- Can we stop climate change? Unfortunately, the answer is no. High concentrations of greenhouse gases already in the atmosphere will continue to cause global warming and climate change for the foreseeable future. But we can limit the amount of warming and avoid some of the worst consequences if we take smart individual and global action to address the causes of climate change. We need to reduce greenhouse gas emissions by transforming energy production, transportation, manufacturing, and food production, and we need to reverse deforestation.
The word climate refers to consistent, repeating patterns in weather. Weather changes from season to season, and even from day to day. But the average yearly temperature or rainfall in your area is probably roughly the same over the course of many years. Maybe you live in an area where just about every spring there are heavy rains, followed by a hot, dry summer. Those weather patterns that persist year after year constitute the climate of your region. [AR5 WG1 1.2.2]
Our planet’s climate system has many components, including the atmosphere, the hydrosphere (oceans, rivers, lakes, and streams), the cryosphere (snow-covered or frozen ground and the polar ice caps), the biosphere (all living things and their habitats), and the land surface (mountains, valleys, rocks, soil, etc.). Global and regional climate are shaped by processes within and between these components, such as the water cycle, how air currents move over mountain ranges, and the way sunlight reflects off of snow-covered ground. Most of the energy (heat) in the climate system comes from the sun. This energy drives the climate system and fuels all life on earth. [AR5 WG1 1.2.2]
The atmosphere consists of many layers. The bottom two layers, called the troposphere (lowest level) and stratosphere (second layer), are the most important for understanding global warming. Some of the energy from the sun reflects off the earth’s outer atmosphere and dissipates out into space. The rest enters the atmosphere. Some is then absorbed by the gases and particulates that make up the atmosphere. Some reflects off the earth’s surface and is either absorbed by the atmosphere or radiated out into space. Some is absorbed by the earth’s land surface and oceans, or enters the biosphere when plants convert it to food. Eventually, some of that energy is stored in the form of fossil fuel deposits in the earth’s crust when life forms die and decompose. [AR5 WG1 1.2.2]
The global climate system is very complex. The many parts of the system are interconnected and always changing. This is an example of a dynamical system, a system of interrelated parts that are undergoing change; changes in one part lead to changes in all parts. Scientists create a model of a dynamical system by describing all the parts and the connections between them, and the forces that create change in the system. Climate science is the branch of science devoted to understanding and modeling the climate system, and using models to make predictions and answer questions. Advances in scientific understanding, computing power, and data gathering equipment (including satellites) have enabled climate scientists to develop a comprehensive understanding of the climate system and how it responds to various influences, including human activity. This is one of the great scientific achievements of our era. [AR5 WG1 1.5]
Due to their chemical composition, some gases in the troposphere have a tendency to absorb energy. In this way, heat from the sun is trapped near the surface of the earth. This is called the greenhouse effect, and such gases are called greenhouse gases (or GHG for short). Without a layer of greenhouse gases in our atmosphere, the earth would be a cold and barren planet. Some greenhouse gases have a more powerful greenhouse effect than others. Water vapor is the most abundant greenhouse gas, but it has a relatively weak effect. Carbon dioxide is less abundant, but more powerful. It is released when we burn carbon-based material such as wood, coal, oil, propane, or natural gas. Of these, coal produces by far the most carbon dioxide when burned. One of the most powerful greenhouse gases is methane, which is released when animals metabolize their food and when life forms decompose. Concentrations of methane in the atmosphere have historically been very low, but livestock production and the release of methane deposits from melting permafrost are causing atmospheric levels to rise. Another greenhouse gas is nitrous oxide, a by-product of industrial and agricultural processes such as fertilizer use. [A table with data on nineteen GHG, including historical atmospheric concentrations, atmospheric lifetime, and radiative efficiency (greenhouse potency) is given as Table 2.1 in AR5 WG1 2.2.]
Greater concentrations of greenhouse gases in the atmosphere cause global warming, an increase in the total energy (heat) contained in the climate system. Much of this heat is absorbed by our oceans. Over the last few decades, scientists have observed steady increases in the temperature of the oceans, the land surface, and the atmosphere. Hurricanes are occurring more frequently as their “breeding ground,” the band of warm equatorial water where they form before migrating to other latitudes, grows wider. More generally, a warmer climate system is more energetic and volatile. Warmer water and air produce stronger winds and storms. All of these factors are starting to have profound and lasting effects on global and regional climate. That is, global warming leads to climate change. [AR5 WG1 2.4, 2.5, 2.6, 2.7].
How do we know that global warming and climate change are taking place, and that the rapid warming we are currently experiencing is due to human activity? There are many independent lines of evidence that support these claims. Here are some of them: [See AR5 WG1 1.2.3 for a summary, and the sections of AR5 indicated below for more detail.]
- The record of atmospheric GHG concentrations: Scientists first began measuring atmospheric CO2 levels directly in the 1950s, and they have used ice core samples and other evidence to estimate levels going back millions of years. We know that levels of CO2 and other greenhouse gases fluctuated very gradually over time until the Industrial Revolution, at which point levels started rising steadily, and more quickly in recent decades. [WG1 6.2, 6.3] (Here is a movie showing CO2 levels going back 800,000 years.)
- A well-understood mechanism: The greenhouse effect was first suspected by Joseph Fourier in the 1820s, and it was demonstrated in the lab and studied extensively by John Tyndall in the 1860s. It is now a well-understood and undisputed phenomenon. We understand the physical and chemical basis for it, and we can measure it directly in the lab and in the atmosphere. We know that an increase in greenhouse gas concentrations should result in warming. [WG1 1.2]
- The temperature record: Temperatures on land, at various depths in the ocean, and in the troposphere show a consistent increase over time, whereas the stratosphere has been slightly cooling, just as one would expect if warming is caused by the greenhouse effect (rather than, say, variations in solar energy output or the earth’s motion through space, which would warm the entire atmosphere). [WG1 2.4, 3.2]
- Other evidence of warming of different parts of the climate system: Ocean levels are rising as ocean waters warm [WG1 3.7]. In many areas, permafrost is weakening and retreating [WG1 4.6]. Glaciers are shrinking [WG1 4.3], polar ice cover is on the whole decreasing [WG1 4.2], and the ice sheets over Antarctica and Greenland are thinning and cracking [WG1 4.4]. Animal and vegetation ranges have shifted, and we’re seeing changes in seasonal onset and migration patterns [WG2 18.1.2]. Tree lines on mountains are shifting upward [WG2 18.3.2]. In addition to warming, the oceans are becoming more acidic, since absorbed CO2 reacts with water to form carbonic acid [WG1 3.8].
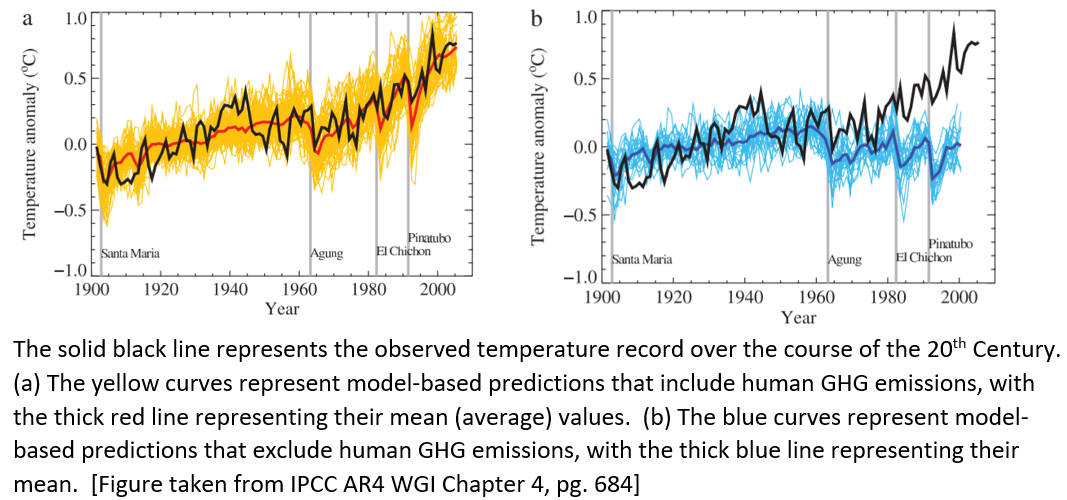
- Matching climate models to observation: When climate models that exclude the influence of human activities are used to simulate temperature change over the course of the 20th Century, the results do not match the record of observed temperature increases. When these models include greenhouse gas emissions from human activity, we get a very close match to observations. Quoting AR5 WG1 Box 9.1, page 750, “What emerges is that the models that plausibly reproduce the past, universally display significant warming under increasing greenhouse gas concentrations, consistent with our physical understanding.”
Many scientists were concerned about global warming due to human activities starting in the 1950s and 1960s. By the late 1980s, the evidence was mounting, and in 1988 the United Nations and the World Meteorological Organization established a task force called the Intergovernmental Panel on Climate Change (IPCC). The purpose of this task force is to survey and report on the science of climate change in order to provide policy makers and the public with information they need to make smart decisions. They have issued regular Assessment Reports (AR), in 1990, 1995, 2001, 2007, and the most recent (AR5) over the course of 2013 to 2014. Each report presents a summary of the latest research findings, with careful attention to how certain scientists are about their data and how confident they are in their conclusions and predictions. These reports represent the consensus of the scientific community on what we know about climate change – what’s happening (trend), what’s causing it (attribution), what the consequences are likely to be (impact), and what we need to do to address it (mitigation and adaptation). They also have detailed references to the scientific literature, so that anyone can review the evidence and judge for themselves.
How do climate scientists make predictions about the future? They use computer models that simulate the climate system. Computer modeling of climate began with weather forecasting after WWII. Since then models have become increasingly complex, taking into account larger portions of the climate system and a better understanding of the processes that govern it. Some parallel developments have been advances in instrumentation (including satellite technology) and rapidly expanding computational power and speed. For a review of the models used in AR5, see AR5 WG1 9.1.2.
These computer models are the same ones used to make weather forecasts over short periods of time. We can make very short term forecasts just by observation; if satellite images show a storm system moving east over the Great Lakes, we are fairly confident it will soon be raining in western New York. But to make accurate forecasts for several days into the future, we need to use computer models that start with data on existing conditions, and then use our understanding of wind currents, air pressure, humidity, the surface of the land in that region, and all other relevant factors to predict how conditions will change over time.
Weather is what mathematicians call a chaotic phenomenon, in the sense that any small difference in the initial conditions might cause a very large difference in later states (“sensitivity to initial conditions”). This property of chaotic systems is sometimes called the Butterfly Effect; a butterfly flapping its wings over China might cause a tornado over Kansas some time later. Very small causes can have very large effects. Since it is impossible to measure existing conditions perfectly (every real world measurement involves some amount of error or uncertainty), then there are inevitable uncertainties in our initial data. This is why even using the best models, weather forecasts tend to diminish in accuracy the further into the future they go; after about ten days or so, they are notoriously unreliable. However, when we use these and similar models to make predictions about climate instead of weather, they are much more accurate over long periods of time, because chaotic variations in weather tend to average out over time, resulting in the more stable and persistent patterns that we call climate. Also keep in mind that when we make predictions about climate, we’re talking about average values over long periods. We aren’t trying to predict the actual temperature on June 7, 2072, in Westfield, NY. We want to predict the average yearly temperature in western New York over the course of the 2070s. We know that these computer models are sound and well-designed; we use them to make very good short term weather predictions. So it is reasonable to use them to make long term climate predictions. [AR5 WG1 Chapter 11, FAQ 11.1]
We can test the quality of those predictions by starting a computer model at some point decades in the past, with data on conditions at that time, and running the model forward to see how well it predicts current conditions. Using this and other calibration techniques, scientists have a comprehensive understanding of how well these models work and how much certainty we can attach to their predictions. [AR5 WG1 9.2]
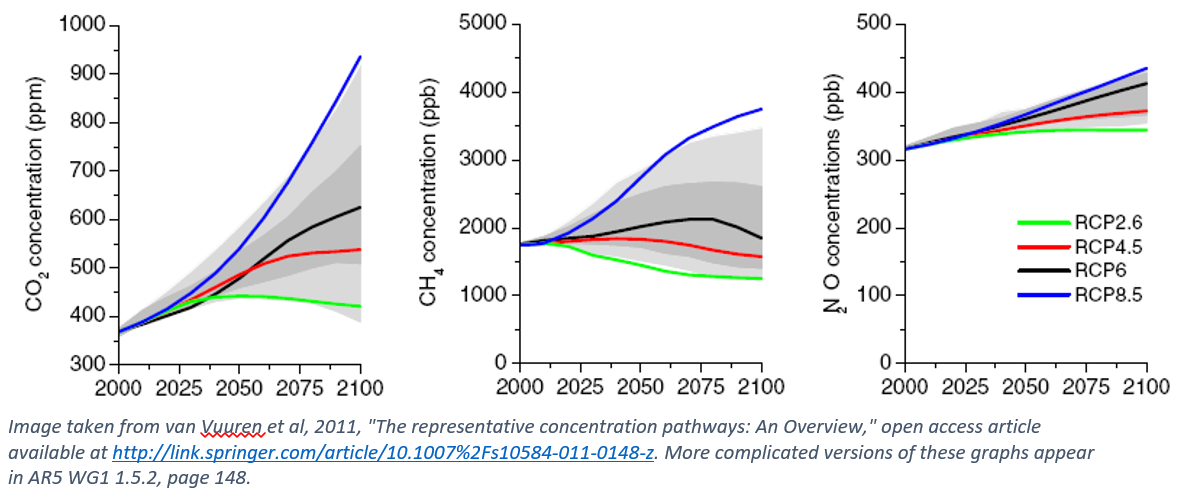
Starting with AR5, the IPCC has made predictions about the impact of greenhouse gas emissions on future climate using representative concentration pathways (RCPs). Each pathway is a possible scenario for how atmospheric concentrations of the three most important greenhouse gases, carbon dioxide (CO2), methane (CH4), and nitrous oxide (N2O), might vary over the course of the 21st Century. Concentrations will continue to go up, at least for awhile, with population growth and expansion of industrialization. They might go up sharply if we do nothing to reduce emission levels, or they might go up more gradually if we take action. They might go up for awhile, then level off and go down as we take more aggressive action and develop new technology to reduce emissions. Which scenario we find ourselves in depends on the choices we make. [AR5 WG1 1.5.2, especially Box 1.1, and AR5 WG1 12.3.1.3]
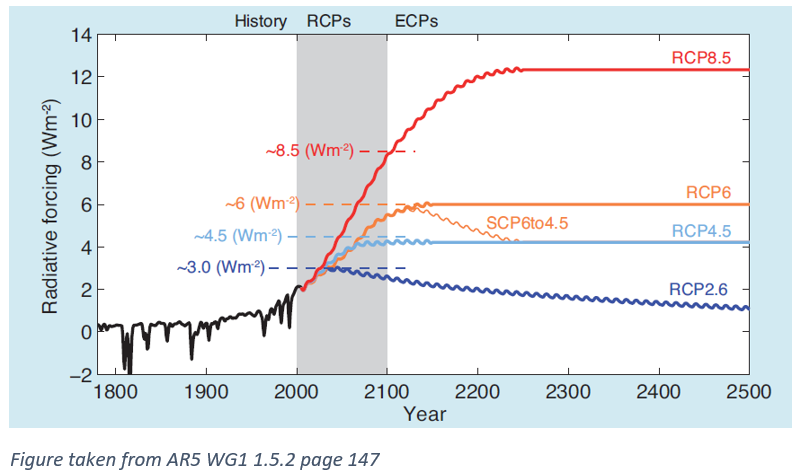
For each scenario, we can predict the amount of global warming that would occur. This is usually expressed as a change in radiative forcing compared to some previous level. Radiative forcing is simply the difference between how much solar energy reaches the earth, and how much is radiated away from the earth. When more heat is trapped in the troposphere due to the presence of greenhouse gases, then less heat is radiated away, resulting in an increase in radiative forcing. The units for measuring radiative forcing are Watts (a unit of energy) per square meter of the earth’s surface, i.e. W/m2. For changes in radiative forcing due to the greenhouse effect, we measure it at the tropopause (the boundary between the troposphere and the stratosphere). That is, the radiative forcing of a certain concentration of greenhouse gases is the increase in energy (in Watts) absorbed by the troposphere, for every square meter of the earth’s surface. [AR5 WG1 1.1.2]
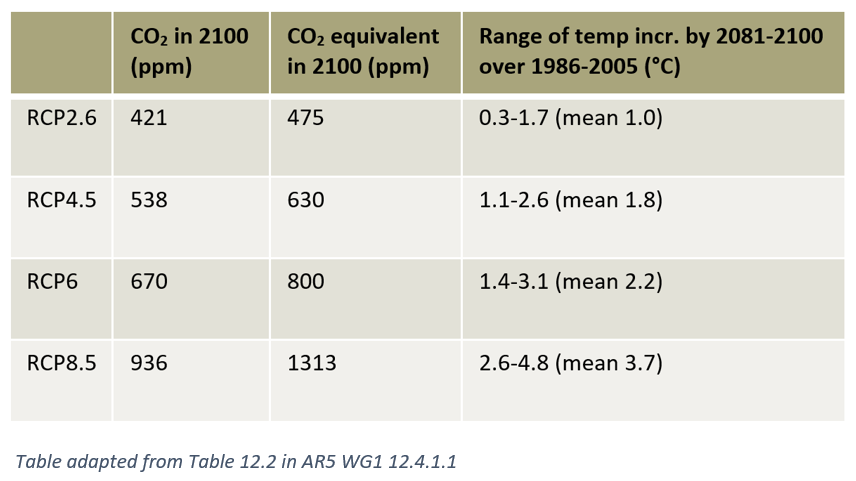
So, for example, RCP2.6 is a scenario that would result in an increase in radiative forcing at the tropopause of 2.6 W/m2 by 2100 compared to 1750 (“preindustrial levels”). In this scenario, CO2 concentrations peak at about 450 parts per million (ppm) in 2050, and then gradually decline to around 420 ppm by the end of the century. This would result in an increase of average global surface temperature that is somewhere between 0.3° and 1.7° C compared to the end of the 20th Century, with a mean of 1.0°. [AR5 WG1 12.4.1]
 How should we interpret this range of possible temperature increases? Climate sensitivity refers to the effect that a change in radiative forcing has on global average surface temperature. This effect is complex because it involves many positive and negative feedback mechanisms. Determining climate sensitivity is an ongoing research problem, and we currently have a range of values associated with each change in radiative forcing, with a statistical analysis of the likelihood of values in this range. If the mean temperature increase is 1.0°, this means that the actual temperature increase is as likely to be higher as it is to be lower than 1.0°.
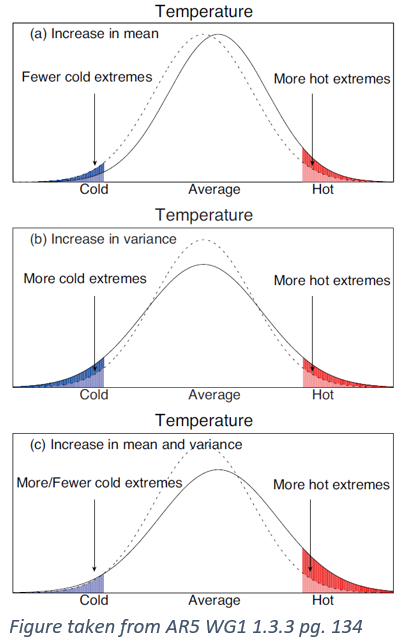
This may not seem like much of an increase, but keep in mind that in a more energetic climate system, temperature ranges are likely to be larger (greater variance) so that temperature highs might be considerably greater than the average, resulting in more frequent, longer-lasting, and more extreme heat waves. The graphs to the right show the effect of both shifting the temperature mean upward and increasing temperature variability. This effect alone will cause significant changes in regional climates, ecosystems, and food production. Also, RCP2.6 is in some ways the most optimistic RCP analyzed in AR5, in that it assumes the greatest reduction in greenhouse gas concentrations (or, to put it another way, it requires the most aggressive action on our part).
The other scenarios examined are RCP4.5, RCP6, and RCP8.5. [AR5 WG1 12.3.1.3] The graphs below show the variation in concentrations of carbon dioxide, methane, and nitrous oxide assumed in each scenario, and the table gives the range of associated temperature increases. Remember that these three greenhouse gases vary in potency; methane is the most powerful of the three, so a small concentration of methane would cause the same radiative forcing as a large concentration of carbon dioxide. For some purposes, rather than listing the concentrations of the three gases separately, it is helpful to give a single value (in ppm), the CO2 equivalent, that represents the concentration of carbon dioxide that would cause the same radiative forcing as the combination of all three. For complete data sets associated with the RCP scenarios, see AR5 WG1 Chapter 12. To see projections under the RCPs broken down by specific regions, see ARG WG1 Annex 1, “Atlas of Global and Regional Climate Projections.”
As we noted above, which scenario we find ourselves in depends on the choices we make. If we do nothing to change our practices (the business as usual model), we are likely committing ourselves to RCP8.5 or a pathway with similar or worse outcomes, depending on factors such as population and economic growth. [AR5 WG1 12.3] The other RCPs studied in AR5 all assume that we take significant action to reduce GHG concentrations.
How did we get ourselves into this situation in the first place? Starting at the time of the Industrial Revolution, people in some countries began burning fossil fuels, especially coal, at accelerated rates. This increase in industrial activity led to great wealth and many improvements in quality of life, but it also led to polluted air, acid rain, and significant increases in atmospheric levels of carbon dioxide. In recent decades, regulation and new technology have helped clean up the air and reduce the phenomenon of acid rain, but greenhouse gas emissions have continued to rise. In the last decade, it has become easier and cheaper to mine natural gas, which is quickly displacing coal in the US due to lower cost. As a result, greenhouse gas emissions in the US have tapered off slightly, since burning natural gas produces less carbon dioxide than coal. However, the US still releases more greenhouse gas per person than any other country. [AR5 WG3 Chapter 5 Executive Summary, pages 354-356]
By contrast, industrialization, with both its economic advantages and its environmental cost, has come only recently to other parts of the world. In developing countries, with less accumulated wealth, governments have chosen to invest their limited funds in building coal-burning power plants, since this has typically been the cheapest and most accessible form of energy production. This has allowed these countries to boost their economic activity and lift portions of their populations out of poverty. However this has also led to surging levels of greenhouse gas emissions globally. One of the biggest drivers of our ever-growing levels of greenhouse gas emissions is population growth, with accompanying increases in food production as well as the consumption of energy and goods. [AR5 WG3 Chapter 5 Executive Summary]
We need to lower greenhouse gas emissions globally in order to slow the rate of climate change. To some extent, we can reduce emissions through greater efficiency and new technology, without actually changing our patterns of consumption. However, to make a large enough impact in emissions, we will need to lower our overall consumption of energy and goods. All of this will come at a cost. Who should take the bulk of the responsibility for lowering emissions? Should it be developed countries, which emit more per capita than developing countries and have also been emitting greenhouse gases at elevated rates for centuries? Or should it be developing countries, which are currently the largest annual emitters because of their burgeoning populations and dependence on coal? These are difficult questions that have complicated efforts to coordinate international action. [AR5 WG3 Chapter 3]